
If we can call Kermit the Frog a great philosopher, we can also call Garth Algar one! He once famously stated, “We fear change.” This should be the official mantra of all condition monitoring analysts, regardless of the technology or technologies they use and the industry they work in.
An unexplained change in a condition monitoring indication, from one collection period to another is never a good thing. But we’ve all been trained to make sure that “Thou Shalt Not Exceed……….” certain values for specific measurements. Our focus is typically on things that increase in amplitude or value which often results in ignoring reductions or the belief that because today’s value for a parameter is less than yesterday’s, then all must be well with the world, or at least that specific machine.
Think about driving your car. You know, from experience, what it sounds like when doing things like backing out of your driveway or accelerating onto the on-ramp to an interstate highway. Both sounds are different, yet both can be considered as normal for what the car is doing at the time. You would certainly recognize that something is wrong when your car sounds like it is accelerating onto the on-ramp while backing out of the driveway, unless of course if you hear it from outside the car while your teenager is backing it out!
So it is with condition monitoring. We should fear changes that we observe that do not have an operational explanation, like a running speed difference, load or process change, flow change due to changes in process or production demand, or result from a recently performed maintenance activity.
Consider the following example, which is a vibration example but could be extended to any condition monitoring technology.
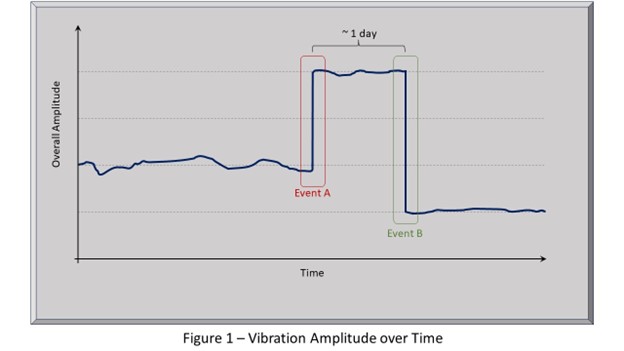
This case involves a low-pressure section of a large steam turbine. The control room turbine control panel only shows the overall vibration amplitude at each bearing. Alarms are set for high amplitude values only. The facility focuses almost exclusively on changes that increase values, like vibration amplitudes or temperatures. Figure 1 shows what was observed on the strip-chart recorder for the overall vibration amplitude at one of the bearings. Vibration had been dithering a couple of percentage points around an average value for several years. On a Saturday, when no vibration analyst was available, vibration at the bearing doubled, which is labeled as Event A on Figure 1, but was not sufficiently high to trip the turbine or activate the alarm. This caused great panic until Sunday when the vibration suddenly reduced to half of its original value, shown as Event B, resulting in sighs of relief that potential disaster had been averted because now, it appeared that the vibration value had improved significantly compared to the previous few years historical values. Nothing could have been further from the truth!
Monday morning the vibration analyst reviewed all of the data that was available from their sophisticated vibration diagnostic system and found that Event B – the one that made everybody else comfortable because of the lower-than-historical amplitude – was actually the more significant event than Event A, which is clearly shown in the polar plot presented in Figure 2. The vector from A to B is double the length of the vector from the long-term historical, indicating its greater physical significance. But the fact that it shot past the origin and ended at a lower amplitude on the other side left people with the misguided impression that things had generally improved when in fact the physical reality was that from the machine health perspective, Event B was worse than Event A! The vibration analyst concluded that two mass loss events must have happened, the second (B) being double the size of the first (A) and likely on the opposite side of the shaft from the first. The turbine, in fact, did not “get better” it got worse!
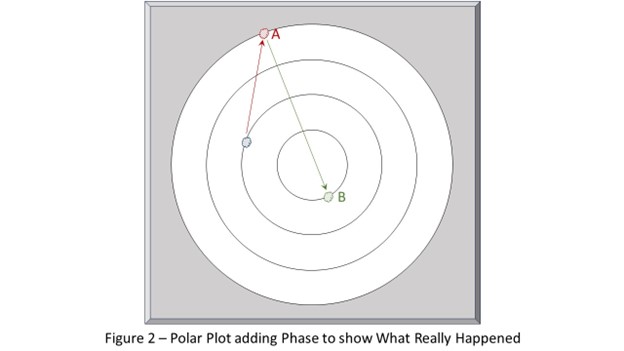
The low-pressure turbine was opened during an outage shortly thereafter and one of the smaller blade sections was found to have three blades missing; one alone and two diametrically opposite it, proving that the analyst’s conclusion from the data was correct.
ATS’ condition monitoring engineers are well experienced in the kinds of operational and maintenance changes that cause changes in condition monitoring indications, both increasing and decreasing. We focus on the “why” behind the changes we observe based on our vast understanding of machinery at the gut level and can determine what is really degradation that needs attention, and what is an expected change based on changing operating conditions or maintenance actions taken since we last saw data on a machine. This is something that only experienced people can do and we always ask the probing questions beyond just looking at the data to determine what, if any, corrective action to recommend.
Party on, Garth! Then contact us at 866.398.9778 or info@ats-inc.org to discuss how we would take a multi-technology approach to help you improve your operational reliability through condition monitoring.


0 Comments